Mostrando entradas con la etiqueta Performance Charts. Mostrar todas las entradas

09 diciembre 2015

Rightsize, Rightsize, Rightsize...

     ¿Rightsize? Si, cada dia es mas frecuente encontrarse con problemas de performance y de gestion de las conocidas como Monster VMs por una asignacion indebida de recursos a una maquina virtual, como si de un entorno fisico se tratase, aun sabiendo que posiblemente todos esos recursos no están correctamente aprovechados, ni siquiera la aplicacion esta diseñada para ello.

"No por asignar mas recursos a una VM se conseguirá mas performance, incluso puede producirse el efecto contrario"

     Es muy importante dedicar tiempo a realizar un dimesionamiento de las aplicaciones correcto, no solo para un uso mejor de los recursos del entorno de virtualizacion si no de la propio rendimiento de la VM y de las aplicaciones que en corran sobre ella.

     El ejemplo mas sencillo lo tenemos con el crecimiento scale-in (vertical, tambien conocido como scale-up) y el crecimeinto scale-out (horizontal)


     En un crecimiento scale-in debemos tener claro que las aplicaciones y el SO seran capaces de aprovechar la asignacion de mas memoria y CPU lo que posiblemente nos obligue a realizar modificaciones, por ejmeplo, en JAVA, si agregamos mas memoria RAM a la VM, deberiamos tocar los parametros de asignacion de la JVM, de lo contrario, la JVM seguiria disponiendo de la misma RAM que antes de su aumento.


     En un crecimiento scale-out, si conseguimos definir un building-block en la cual una VM con uan configuracion determinada de RAM y CPU, soporte por ejemplo un carga especifica de usuarios, ante eventos de crecimiento de demanda, sera mas sencillo desplegar desde la plantilla del building block tantas VMs como sean necesarias para soportan la nueva demanda, ahorrando ademas en tiempos de reconfiguracion y despliegue.

     Que se conseguimos con VMs mas pequeñas: al tener menos vCPU en estado iddle, el rendimeinto de una VMs en mas eficiente, reduciendose los valores de CPU Ready, CPU Wait y Co-Stop en la mayoria de las ocasiones (tendieno en cuenta que se realize un overcommit de los recursos del host ESXi de forma adecuada)

     A todo esto podemos añadirle las facilidades de getion de una VM mas pequeña e incluso poder protegerla con Fault Tolerace de VMware con tiempo de caida cero (downtime=0) que desde la version ESXi6 soporta ya 4 vCPU y hasta 64GB de RAM por VM protegida, unicamente hay un maximo de 8 vCPU protegidas por host ESXi lo que nos permite varias combinaciones.

    Como detalle a configurar para nota,  recordad cambiar en las BIOS de los host ESXi el performance en nivel HIGH, los valores balanced o low impactan negativamente en el rendimiento de las VM (en la mayoria de los servidores viene en modo balanced configurado de fabrica)

Rightsize, Rightsize and Rightsize


11 octubre 2013

VMware & Oracle performance tips on NFS NetApp storage

     Los problemas de rendimiento son tediosos de resolver y no siempre tienen su origen donde apuntan las primeras hipótesis cuando alguien destapa la caja de los truenos y se queja del bajo rendimiento de algún servidor virtualizado.

    Es muy habitual que por desconocimiento de la virtualizacion, se la culpe siempre en primer termino de todos los males... saber conectarse a un vCenter y crear una maquina virtual "no" es saber de virtualizacion.

     Siempre debe realizarse un trabajo conjunto de todas las áreas implicadas. Me explico, un problema de performance de una maquina virtual no es un problema exclusivo de VMware o del virtualizador de turno, es un problema en el que interviene muchos elementos y departamentos como Storage, Networking, BBDD, etc.
 
    La suma de acciones suele generar buenos resultados al final de los analisis de problemas de rendimiento y todos los departamentos suelen enriquecerse de esas experiencias... asumir una mejora no es culparse de un error si no aportar valor y conocimiento ..al hilo de lo cual os recuerdo lo importante de documentar todo lo que podamos "el ser humano es el unico animal que tropieza dos veces en la misma piedra, porque la primera no lo documenta".


Vamos al turrón con 3 puntos básicos que aunque focalizamos en VMware, NetApp y Oracle lo podemos hacer extensible a cualquier entorno virtual, de almacenamiento y de bbdd:

1-Aplicar best practices de NetApp (consultar antes de aplicar con el fabricante):

Foco de atención sobre:
-Revisar configuración del Networking del NFS: uso de VLAN aislando para trafico NFS, misma subnet red NFS servidor y NAS, reducir saltos de red fisica entre el servidor y la NAS, habilitar jumbo frames a nivel de NFS, utilizar tarjetas 10GbE, realizar teaming (vifs & etherchannel) y revisar políticas de balanceo.
-Revisar el alineado de los FileSystem y VM´s.
-Aplicar recomendaciones del plugin NetApp integrado en el vCenter (consultar antes con fabricante)
-Revisar capacidad de IOps de agregados y controladoras (Monitorizar con OnCommand Core)
-Revisar configuración de los agregados: “añadir discos físicos y forzar reallocate”, verificar planificación de la deduplicacion, revisar estado thinprovisioning y espacio libre en NAS, revisar planificación de snapshots, revisar configuración de RAID óptima para mayor rendimiento de VM´s criticas.
- Estudiar opción crear agregados flashpools con SSD.
-Estudiar opción conexión por FC para VM´s criticas.

Documentación relacionada:
NetApp Technology - Monitorización OnCommand-Core
NetApp Storage Best Practices for VMware vSphere
NetApp Technology - Alineación de Máquinas Virtuales
NetApp, Best Practices for File System Alignment in Virtual Environments
NetApp, location of the mbrscan and mbralign tools
Clustered Data ONTAP NFS Implementation Guide
NetApp Data Compression and Deduplication Deployment and Implementation Guide
VMware vSphere 5 on NetApp Clustered Data ONTAP 8.1
NetApp and VMware Virtual Infrastructure 3 Storage Best Practices (uno de los TR mas populares de NetApp)


2-Aplicar best practices de VMware para NFS:

Foco de atención sobre:
-Reasignación de los datastores (vol): tamaños, y disposición en los aggr
-Redimensionar nº de VM´s en diferentes datastores y agruparlas por tipo de SO
-Reasignar VM´s criticas en vols independientes.
-Verificar estado VAAI para NFS (opciones limitadas)
-Revisar y optimizar shares de Disco, CPU y RAM de las VM´s criticas
-Crear varios vmkernel para NFS con diferentes ip´s y asignar diferentes nics de salida para repartir trafico. ( 1 vSwitch para NFS con 2 vmkernel > vmkernel01 con nic1 activa y nic2 pasiva, vmkernel02 con nic2 activa y nic1 pasiva)
-Configurar vDS que permita agregar varias nics fisicas en el mismo port group para NFS y obtener mayor capacidad de carga y/o balanceo (IP Hash, con limitaciones)
-Modificar parámetros avanzados de NFS

Documentación relacionada:
Increasing the default value that defines the maximum number of NFS mounts on an ESXi/ESX host
NFS with IP Hash Load Balancing
Best Practices for Running VMware vSphere on Network-Attached Storage (NAS)
Verify Hardware Acceleration Status for NAS
Performance Implications of Storage I/O Control–Enabled NFS Datastores in VMware vSphere 5.0
Best Practices for Performance Tuning of Latency-Sensitive Workloads in vSphere Virtual Machines
Performance Implications of Storage I/O Control-Enabled NFS Datastores
Load Balancing with NFS and Round-Robin DNS

3-Aplicar best practices de VMware para Oracle (BBDD):

Foco de atención sobre:
-No realizar overcommit de CPU y RAM (Reserva de RAM: virtual memory size = Oracle System Global Area + operating system)
-Uso de menos vCPU es más eficiente que uso de muchas vCPU
-Alineado de FS con la NAS
-Habilitar JumboFrames en VMware NFS y NAS
-Utilizar Paravirtual SCSI  (PVSCSI)  kb.vmware.com/kb/1010398

Documentación relacionada:
Running Business-Critical Applications on Oracle RAC, VMware and NetApp
Oracle® Databases on VMware vSphere™ 4 ESSENTIAL DEPLOYMENT TIPS
VMware vCenter Server 5.1 Database Performance Improvements and Best Practices for Large-Scale Environments
Oracle Databases on VMware VMware vSphere 5 RAC Workload Characterization Study (VMware VMFS)
Oracle Databases on VMware High Availability
Oracle Databases on VMware Best Practices Guide
Oracle Databases on VMware RAC Deployment Guide
Oracle Dev/Test on VMware vSphereand NetApp Storage Solutions Overview


...Mucho que leer y mucho que aprender :-)

09 octubre 2013

Do you know what NUMA is? really? - Part 2

Once we have clear the NUMA concept, let´s go review the use on VMware.

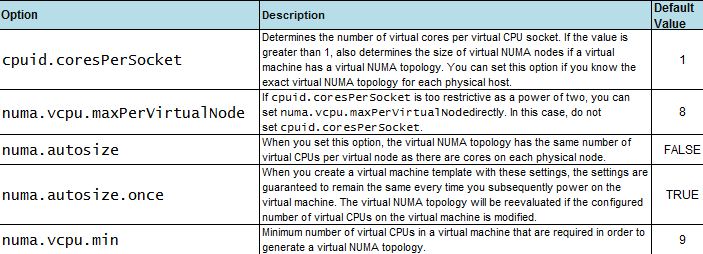
    NUMA topology is avaliable on VMware vSphere 5.0 and later,  hardware version 8 and later, and it´s enable by default when the virtual CPU is greater than 8, but it can be disabled or modify using advanced options (to enable vNUMA on 8 way or smaller VMs, modify the numa.vcpu.min setting) :


    When CPU affinity is enable on a virtual machine, it´s treated as a NON-NUMA client and gets excluded from NUMA scheduling. It means that the NUMA scheduler will not set a memory affinity for the virtual machine to its current NUMA node and the VMkernel can allocate memory from every available NUMA node in the system. It wil increase memory latency and probabbly the value  %RDY will get higher.


An example how NUMA (or vNUMA) works:


With NUMA enable, the Virtual Machine will get vCPU from the same NUMA node (it is, from the same socket)

But.... what´s about the best practices?

1-NUMA-nodes: take your time and the sockets features carefully because some physical cpu´s are composed with 2 underlying sockets. For example some ADM opteron wich have sockets with 12 cores are composed inside with 2 sockets and 6 cores each. It is, a server with 4 sockets 12 cores each.... are a 8 NUMA nodes and not 4.

2-The "default" config on a new VM is "cores per socket" equal to 1, it means that vNUMA is enabled and let the virtual topology to present the best performance to the VM.

3-If the number of "cores per socket" needs to be changed (for licensing purposes for example) the vNUMA will not apply the best config to the VM and will affect to performance. Only you choose a right combination with the vCPUs and cores per socket mirroring the physical NUMA topology on your server (review your NUMA-nodes config)

4-Cluster and DRS or vMotion: "One suggestion is to carefully set the cores per virtual socket to determine the size of the virtual NUMA node instead of relying on the size of the underlying NUMA node in a way that the size of the virtual NUMA node does not exceed the size of the smallest physical NUMA node on the cluster. For example, if the DRS cluster consists of ESXi hosts with four cores perNUMA node and eight cores perNUMA node, a wide virtual machine created with four cores per virtual socket would not lose the benefit of vNUMA even after vMotion. This practice should always be tested before applied. (VMware transcript) "


11 septiembre 2013

Do you know what NUMA is? really? - Part 1

This post is about NUMA concept, because many people speaks about NUMA and don´t know "really" what is or how to use it.

By the way, NUMA is refered to the server platforms with more than one system bus and dedicates different memory banks to different processors. 

See an example with 2 bus (2 sockets) which  access to their own memmory banks internally and  access the rest memmory banks when interleavng is disable on the BIOS :


Each CPU (socket) + local memory = NUMA node

In the past, there were servers with only one bus and the CPU was increased in Ghz  more and more, and the memmory consumtion grow up; it´s teh cause nowadays the servers have more than one bus and you must install the memmory on banks pairing the bus.

If the memory is not populated correctly and distributed equally across the nodes the O.S. stop responding and display a purple screen (PSOD) with the following NUMA node error message:


In a NUMA architecture, processors may access local memory quickly and remote memory more slowly. This can dramatically improve memory throughput as long as the data are localized to specific processes (and thus processors). On the downside, NUMA makes the cost of moving data from one processor to another, as in workload balancing, more expensive.  The high latency of remote memory accesses can leave the processors under-utilized, constantly waiting for data to be transferred to the local node, and the NUMA connection can become a bottleneck for applications with high-memory bandwidth demands.

However, an advanced memory controller allows a node to use memory on all other nodes, creating a single system image. When a processor accesses memory that does not lie within its own node (remote memory), the data must be transferred over the NUMA connection, which is slower than accessing local memory. Memory access times are not uniform and depend on the location of the memory and the node from which it is accessed, as the technology’s name implies.

Memory interleaving refers to the way the system maps its memory addresses to the physical  memory locations in the memory channels and DIMMs. Typically, consecutive system memory addresses are staggered across the DIMM ranks and across memory channels in the following manner:

>Rank Interleaving. Every consecutive memory cache line (64 bits) is mapped to a different DIMM rank.
>Channel Interleaving. Every consecutive memory cache line is mapped to a different memory channel.

disabling Node Interleaving = NUMA active
At least, NUMA options is only avaliable on Intel Nehalem and AMD Opteron 


Next post "Part 2" will review the NUMA use on VMware.

10 septiembre 2013

Sizing Storage

Once you get a clear idea who-are-who on the complicated I/O latency world (review other two post here and here).....you need to think about the general rules and best practices to sizing storage for your IOPS needs.


GAVG (Guest Average Latency) total latency as seen from vSphere
KAVG (Kernel Average Latency) time an I/O request spent waiting inside the vSphere storage stack.
QAVG (Queue Average latency) time spent waiting in a queue inside the vSphere Storage Stack.

DAVG (Device Average Latency) latency coming from the physical hardware, HBA and Storage device.

Bad performance if:

High Device Latency: Device Average Latency (DAVG) consistently greater than 20 to 30 ms may cause a performance problem for your typical application.
High Kernel Latency: Kernel Average Latency (KAVG) should usually be 0 in an ideal environment, but anything greater than 2 ms may be a performance problem.

And now, what about the storage?

The typical workload show on this picture, is for the most of the virtual machines, but, othre types like DDBB are so different and will need special configuration like dedicated raidgroups, ssd cache pools, etc.

It´s so important when planning and sizing a infrastructure to bear in mind not only the storage, it´s a mix with the raid conf, diskt typs (ssd, sas, sata), the storage protocol (FC, FCoE, iSCSI or NFS), networking and conf (cabling, switch, vlans conf), vmware conf (storage adapters, datastores conf (vmfs, rdm, advanced parameters) and so on.


05 septiembre 2013

Visual ESXTOP GUI for VMware

The VMware visualESXTOP is a tool from the VMware Labs to view in windows-mode (hehehe) the results of the cli command ESXTOP and with a friendly option to generate some graphics

1- Download it from: http://labs.vmware.com/flings/visualesxtop  and unzip files:


2- Change PATH on the System Properties - Advanced System Settings - Advanced - Environmet Variables - System Variables: "PATH=C:\Program Files (x86)\Java\jre6\bin;
(Be carefull with this changes , and backup all the the info you modify for a restore case)


3- Start from CMD or click on the "visualEsxtop.bat" and connect to a ESX host or to a vCenter Server from Menu; File - Connect to Live-server, or start it from powercli:


This will open a new window with the GUI:

Now, you can review al the metrics from the diferents tabs:

...And generate some graphics , for example de% CPU ready:


.

29 agosto 2013

How to test network performance with Netperf

As we can read at the offcial webpage: "Netperf is a benchmark that can be used to measure the performance of many different types of networking. It provides tests for both unidirecitonal throughput, and end-to-end latency"

It´s so usefull to test network performance between two virtual machines , for example from a database server to the aplicacion client.

First, download Netperf for Linux or Windows O.S and install or unzip it:


    Linux:  http://www.netperf.org/netperf/DownloadNetperf.html

    Windows: https://i18n-zh.googlecode.com/files/NetPerf-2.4.5-w32.zip


See a Windows example:

-Start server side. You can specified a port with -p


-Start client side. With -h you can see all the options.


In this case, we get a test with the result 524,55 Mbit/s (Mbps) between two virtual machines.


The simple test run for 10seconds, but this can be changed to. Netperf -h:

E:\datos\NetPerf-2.4.5-w32>netperf -h

Usage: netperf [global options] -- [test options]

Global options:
    -a send,recv      Set the local send,recv buffer alignment
    -A send,recv      Set the remote send,recv buffer alignment
    -B brandstr       Specify a string to be emitted with brief output
    -c [cpu_rate]     Report local CPU usage
    -C [cpu_rate]     Report remote CPU usage
    -d                Increase debugging output
    -D [secs,units] * Display interim results at least every secs seconds
                      using units as the initial guess for units per second
    -f G|M|K|g|m|k    Set the output units
    -F fill_file      Pre-fill buffers with data from fill_file
    -h                Display this text
    -H name|ip,fam *  Specify the target machine and/or local ip and family
    -i max,min        Specify the max and min number of iterations (15,1)
    -I lvl[,intvl]    Specify confidence level (95 or 99) (99)
                      and confidence interval in percentage (10)
    -l testlen        Specify test duration (>0 secs) (<0 bytes="" font="" trans="">
    -L name|ip,fam *  Specify the local ip|name and address family
    -o send,recv      Set the local send,recv buffer offsets
    -O send,recv      Set the remote send,recv buffer offset
    -n numcpu         Set the number of processors for CPU util
    -N                Establish no control connection, do 'send' side only
    -p port,lport*    Specify netserver port number and/or local port
    -P 0|1            Don't/Do display test headers
    -r                Allow confidence to be hit on result only
    -t testname       Specify test to perform
    -T lcpu,rcpu      Request netperf/netserver be bound to local/remote cpu
    -v verbosity      Specify the verbosity level
    -W send,recv      Set the number of send,recv buffers
    -v level          Set the verbosity level (default 1, min 0)
    -V                Display the netperf version and exit

For those options taking two parms, at least one must be specified;
specifying one value without a comma will set both parms to that
value, specifying a value with a leading comma will set just the second
parm, a value with a trailing comma will set just the first. To set
each parm to unique values, specify both and separate them with a
comma.
* For these options taking two parms, specifying one value with no comma
will only set the first parms and will leave the second at the default
value. To set the second value it must be preceded with a comma or be a
comma-separated pair. This is to retain previous netperf behaviour.
E:\datos\NetPerf-2.4.5-w32>


Take care with the units (about caudal, no about velocity):

106 bit = 1 000 000 bit/s = 1 Mbit/s

1 megabyte/s = 8 megabit/s

1 megabit/s = 1000 kilobit/s = 125 kilobyte/s

UnitBitsBits / 1,000,000
Mega-bit1,000,0001.0
Mebi-bit1,048,5761.05
Mega-byte8,000,0008.0
Mebi-byte8,388,6088.39
Links:


24 febrero 2013

Analizar disc bottlenecks en VMware

Para analizar los cuellos de botella en VMware podemos utilizar las gráficas del performance de los host o bien utilizando el comando esxtop.  Básicamente tenemos que fijarnos en los parámetros que nos reportan info sobre la latencia que determinara en buen o mal rendimiento del storage (cabina).

>>>>Con la grafica performance:

Kernel disk command latency: mide el tiempo que tarda el VMkernel en procesar una peticion scsi y no debe ser superior a 3 ms. Si es superior el problema puede deberse a un carga muy alta de trabajo o bien en el ESXi o bien en la cabina, lo que quiere decir que se estan enviados mas throughput a la cabina de la que puede soportar.

Physical device command latency: mide el tiempo que el disco de la cabina necesita para ejecutar completamente una peticion scsi y no debe ser superior a 15 ms. Si es superior el problema esta en la cabina, esos si, depende del fabricante y de lo epserado para su rendimiento ya que no es lo mismo un cabina con discos SAS que SATA, o que este conectada con NFS o FC. Una solucion seria mover los vmdk a una lun con mas discos fisicos por debajo o agregar mas discos fisicos  a la LUN.

>>>>Con ESXTOP:


KAVG: "Esta es la cantidad de tiempo que el comando pasa en el VMkernel".  El tiempo o latencia que se produce desde que se pide un dato a la cabina hasta que lo procesa VMkernel del ESXi. Su valor debe rondar el 0.

DAVG: "Este es el tiempo promedio de respuesta en milisegundos por comando enviado al dispositivo"  Es el tiempo o latencia desde que el ESXi ejecuta el comando de peticion del dato al disco (KAVG) hasta que la cabina devuelve este dato. Si este valor esta por encima de los 20 ms el problema esta en la cabina.

GAVG: (KAVG + DAVG). "Este es el tiempo de respuesta, que es percibido por el sistema operativo Guest. Este número se calcula con la fórmula:  DAVG + KAVG = GAVG". Este es el valor de latencia que qfecta a la maquina virtual directamente.

Segun VMware , ninguno de estos valores debe sobrepasar los 10 ms durante periodos prolongados de tiempo, lo que no dicen es cuanto consideran que es un periodo prolongado de tiempo.

>>>>Revisando los LOG:

Si se producen problemas de latencia con tiempos altos, podemos ver en los logs los errores iscsi en las siguientes rutas en funcion de la version del ESXi:

          ESX 3.5 and 4.x – /var/log/vmkernel

         ESXi 3.5 and 4.x – /var/log/messages 

         ESXi 5.x - /var/log/vmkernel.log

El tipo de registro de almacenamiento que puede ver en estos archivos depende de la configuración del servidor. Usted puede encontrar el valor de estas opciones en:  Host > Configuration > Advanced Settings > SCSI > SCSI.Log or SCSI.Print.

>>>Lectura recomendada: vSphere Monitoring and Performance vSphere 5.1

20 junio 2012

Valores de rendimiento para VMware (VMware Performance Indicators)

Para saber si el rendimiento de nuestras maquinas virtuales sobre una plataforma VMware vSphere es bueno o malo, debemos fijarnos en las siguientes métricas y valores máximos para considerar que el performance es aceptable:

Performance AreaObjectCounterAcceptable range
CPUHostUsageLess than 80%
CPUVirtual MachineReadyLess than 3%
MemoryHostConsumedGeneral trend is stable
MemoryHostBalloon/Swap used0 Kb
DiskSpecific datastoreKernel command latencyLess than 3ms
DiskSpecific datastorePhysical device command latencyLess than 20ms
DiskSpecific datastoreAverage commands issued per secondLess than LUN capacity
NetworkHostReceive packets dropped/Transmit packets dropped0 packets


.

01 junio 2011

Best Practices Analyzer para Windows 2008 R2

Todo sistema operativo requiere de un seguimiento proactivo para evitar problemas....hummm... si, hablamos de Microsoft claro.

Una de las opciones que nos presenta Ms es un extenso documento llamado Best Practices Analyzer de 110 paginas en el que podeis encotrar practicas recomendadas orientadas a analizar el performance desde memoria, storage I/O, network I/O... tuning para remote desktop, etc.

Lo mas interesante de este documento es que no indica cuales son los contadores que debemos seleccionar para monitorizar el rendimiento de cada objeto de estudio con el Performance Monitor de Windows.

De recomendad lectura si teneis que lidiar con güindous habitualmente:
http://msdn.microsoft.com/es-es/windows/hardware/gg463392.aspx

24 febrero 2011

Guias para solucionar problemas de rendimiento de VMware vSphere 4.1

Recien salida del horno la nueva guia para solucionar problemas de rendimiento de Vmware vSphere 4.1 de Febrero de 2011: "Performance Troubleshooting
for VMware vSphere 4.1"

http://communities.vmware.com/servlet/JiveServlet/download/10352-2-28235/vsphere4-performance-troubleshooting.pdf

Os dejo tambien el resto de enlaces a documentacion actualizada de VMware vSphere:

• vSphere Basic System Administration
   http://www.vmware.com/pdf/vsphere4/r41/vsp_41_dc_admin_guide.pdf

• vSphere Resource Management Guide
   http://www.vmware.com/pdf/vsphere4/r41/vsp_41_resource_mgmt.pdf

• Large Page Performance
   http://www.vmware.com/resources/techresources/1039

• Timekeeping in VMware Virtual Machines
   http://www.vmware.com/resources/techresources/238

• Timekeeping best practices for Linux
   http://kb.vmware.com/kb/1006427

• Java in Virtual Machines on VMware ESX: Best Practices
   http://www.vmware.com/resources/techresources/1087

• Managing Performance Variance of Applications Using Storage I/O Control
   http://www.vmware.com/resources/techresources/10120

• VMware Network I/O Control: Architecture, Performance and Best Practices
   http://www.vmware.com/resources/techresources/10119

16 febrero 2011

Acciones a considerar analizando graficas de rendimiento de VMware, Cap.I

Las graficas de rendimiento de Vmware ó "Performance Charts" nos pueden ayudar para tomar decisiones para mejorar o aumentar el rendimiento del entorno virtual:

>Sobre las graficas de CPU: en lineas generales, si la uso de la CPU de una maqiuna virtual esta por encima del 90% y el valor CPU ready esta por encima del 20% el rendimiento de la maquina estara afectado. Si es asi, debemos considerar estas opciones:

-Verificar que las VMware tools esta instaladas y actualizadas correctamente
-Si el cluster no esta en formato DRS, habilitarlo en las settings del Cluster.
-Si el cluster es DRS,aumentar numero de host y migrar una o mas maquinas virtuales al nuevo host.
-Verificar la agresividad del valor de threshold, si esta en low, aumentarlo y probar el rendimeinto.
-Aumentar en numero de CPU de los host o las vCPU de las maquinas virtuales.
-Habilitar las opciones de ahorro de CPU como en TCP Segmentation Offload.

>Sobre las graficas de Disco: si los valores de latencia son altos o hay problemas en general de rendimiento de los discos, consideremos estas opciones:


-Aumentar la memoria de la maquina virtual. Esto ayudara a reducir la actividad de I/O, ya que la memoria se podra utilizar para cachear datos y no recurrir a su escritura en disco. Para verificar si las maquinas virtuales tienen la cantidad de memoria adecuada, debemos revisar las estadisticas de la swap en el sistema operativo guest.
-Defragmentar los file system de los sistemas operativos guest
-Desactivar los antivirus que escanean los ficheros VMDK y los VMEM.

-Utilizar Storage VMotion para migrar maquinas con I/O-intensivo hacia otros host ESX/ESXi.
-Repartir los storage sobre diferentes LUNs que esten conectadas por diferentes adaptadores
-Verificar que la cache de las controladoras HBAs y RAID estan correctamente dimensionadas.

-Ajustar el parametro Disk.SchedNumReqOutstanding (Revisar la guia de "Fibre Channel SAN Configuration Guide")

-Para las maquinas de uso intensivo, separar el disco fisico de la maquina virtual del drive que contenga el system-page-file (archivo de paginacion).
-Deshabilitar el "memory trimming" añadiendo la linea MemTrimRate=0 en la configuracion del VMX de la maquina virtual
-En maquinas de uso muy intensivo de I/O, asiganar el espacio total del disco en "preallocated" en el momento de crearlo: "Allocate all disk space now", con lo que no se va a degradar el rendiemiento cuando necesite crecer y ocupar espacio en disco fisico.

...en proximos post hablaremos de los valores de RAM y NETWORKING.